Welcome to the Freeform Modelling 2022 companion course!
Here you can rewatch the recordings of the sessions and have go at the modelling exercises at your own pace.
- Manager: Jake Chambers
- Manager: Mark Mullany
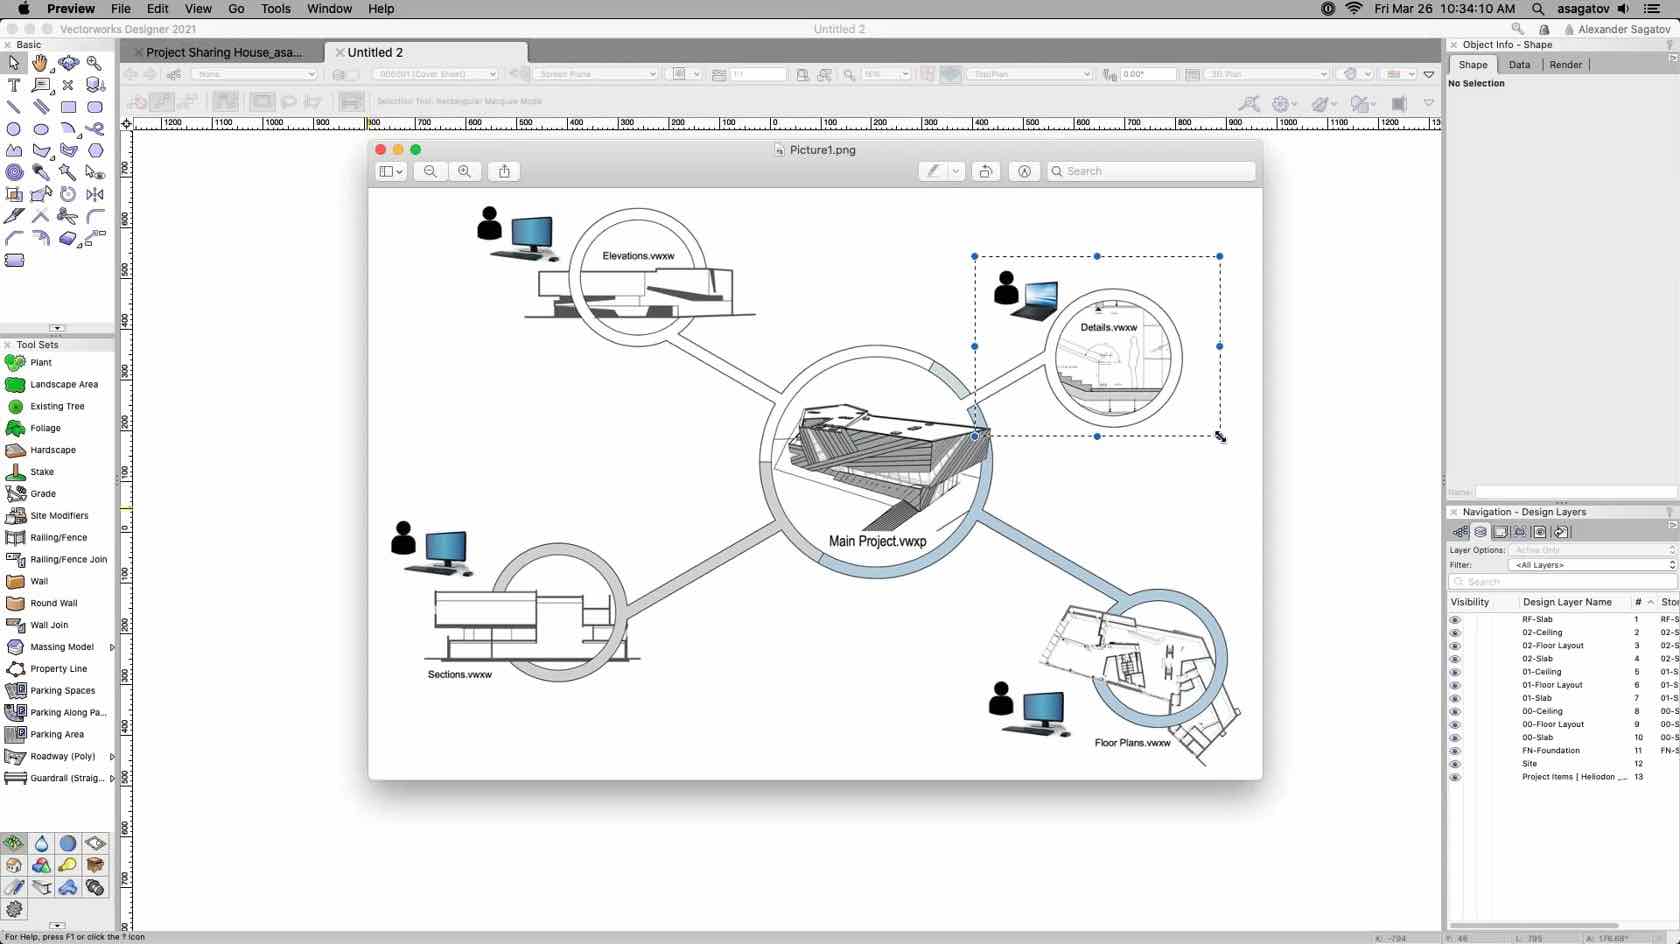
Join the US Onboarding Specialist, Alex Sagatov as we take you through Project Sharing. Project Sharing allows multiple users to work on a file simultaneously through the use of Working Files and a checking out system. Reduce the need for complicated referencing trees and increase in-house collaboration with Project Sharing!
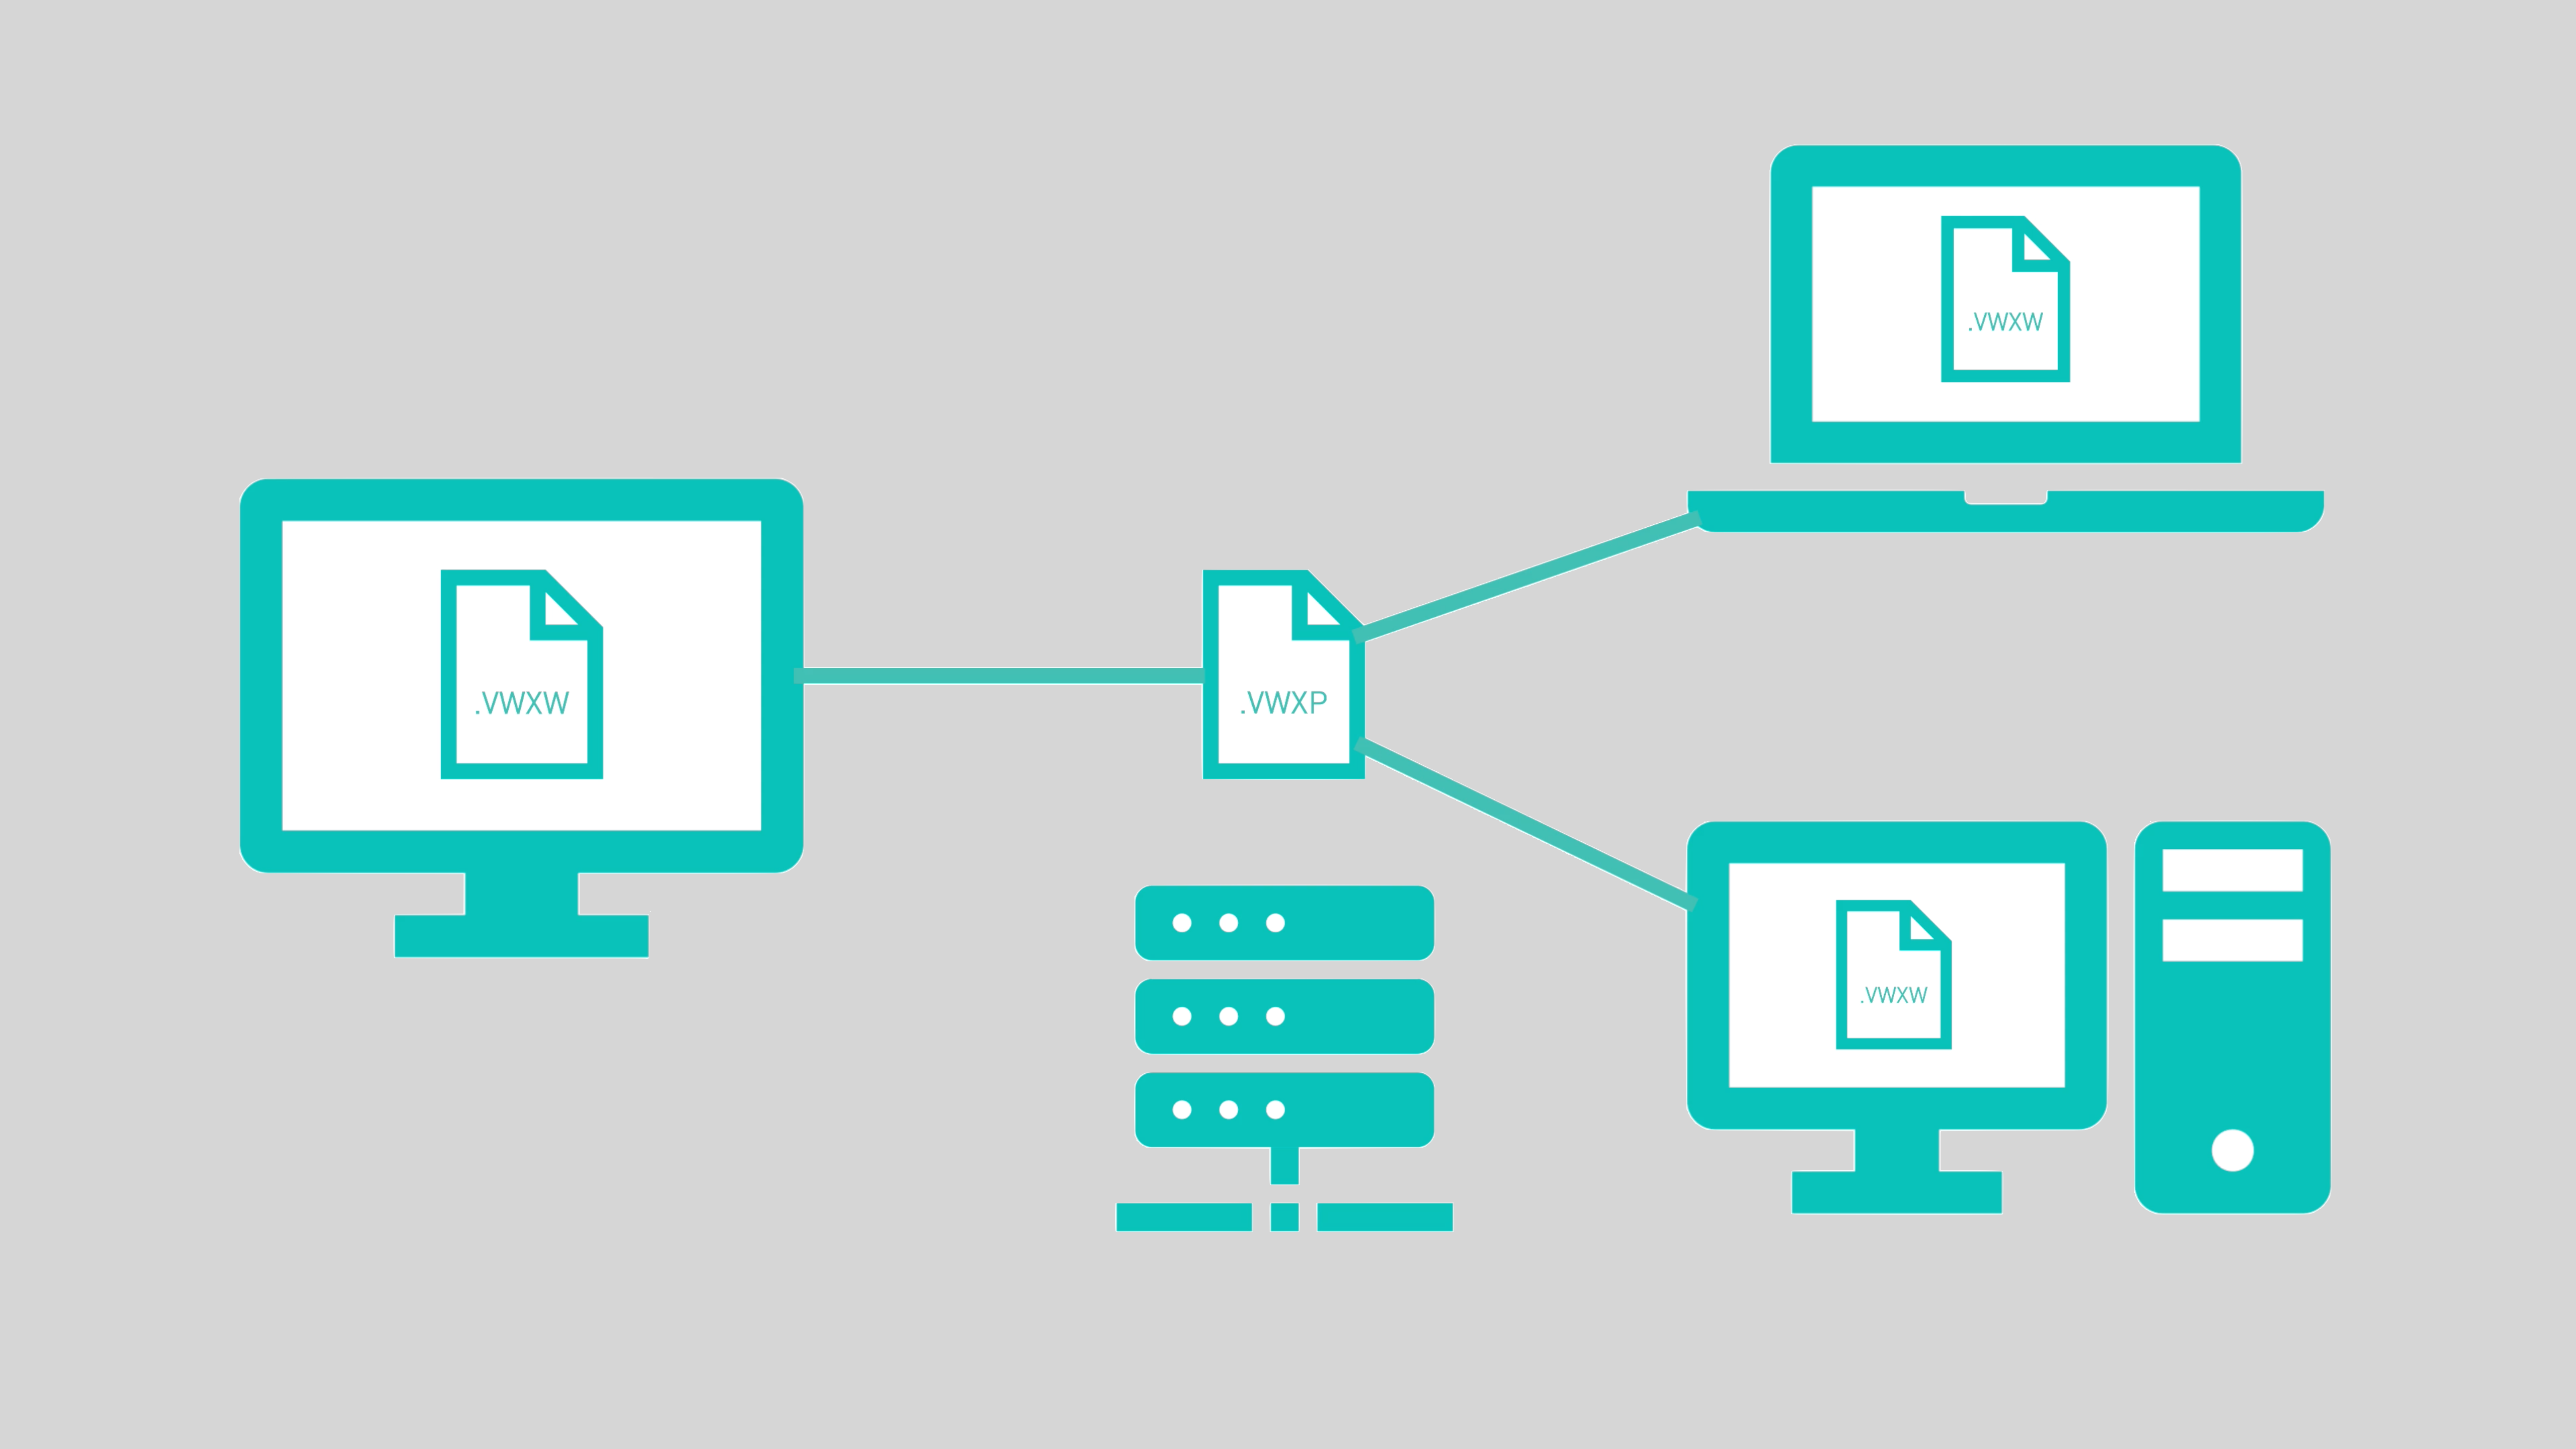
Learn how to install and setup the Project Sharing Server, introduced with Vectorworks 2021.
LEARNING OBJECTIVES
- Download the Project Sharing Server installer.
- Install the Project Sharing Server.
- Create Project Sharing files.
- Join a project on the server.

Take your Vectorworks knowledge to the next level! The Intermediate Concepts course is the best option to help you become proficient with information modeling and integrating 2D drafting skills with 3D modeling.

Note: This course is recommended for customers using Vectorworks 2018-2020. If you are using a newer version of Vetorworks, please check out our Vectorworks Core Associate Certification course.
Learn how to utilize tools, menu commands, and drawing organization found in Vectorworks software. Core Concepts starts from the ground up, teaching you all of the necessary basics needed to become a Vectorworks pro. Make use of 2D and 3D modeling techniques from the start and learn the entry points and correct workflows to help master the Vectorworks platform.


